
Staking Dashboard
The Staking Dashboard is your central hub for real-time statistics and trends about staking activity on the IO.net platform. Crafted for clarity and efficiency, it offers a comprehensive overview of essential staking metrics to keep you updated.
To view the Staking Dashboard tab, go to io.net > IO Explorer > Staking Dashboard.
Staking Tab
Key Features
- Net Staked Amount (TVL in $IO): Displays the total value locked in staking, representing active stakes in $IO coins.
- Net Staked Amount (TVL in USD): Displays the total value locked in staking, representing active stakes in USD.
- Monthly Staked Amount: Shows the total amount staked within the current month.
- GPU/CPU With Full Stake: Lists devices that meet the complete staking requirements.
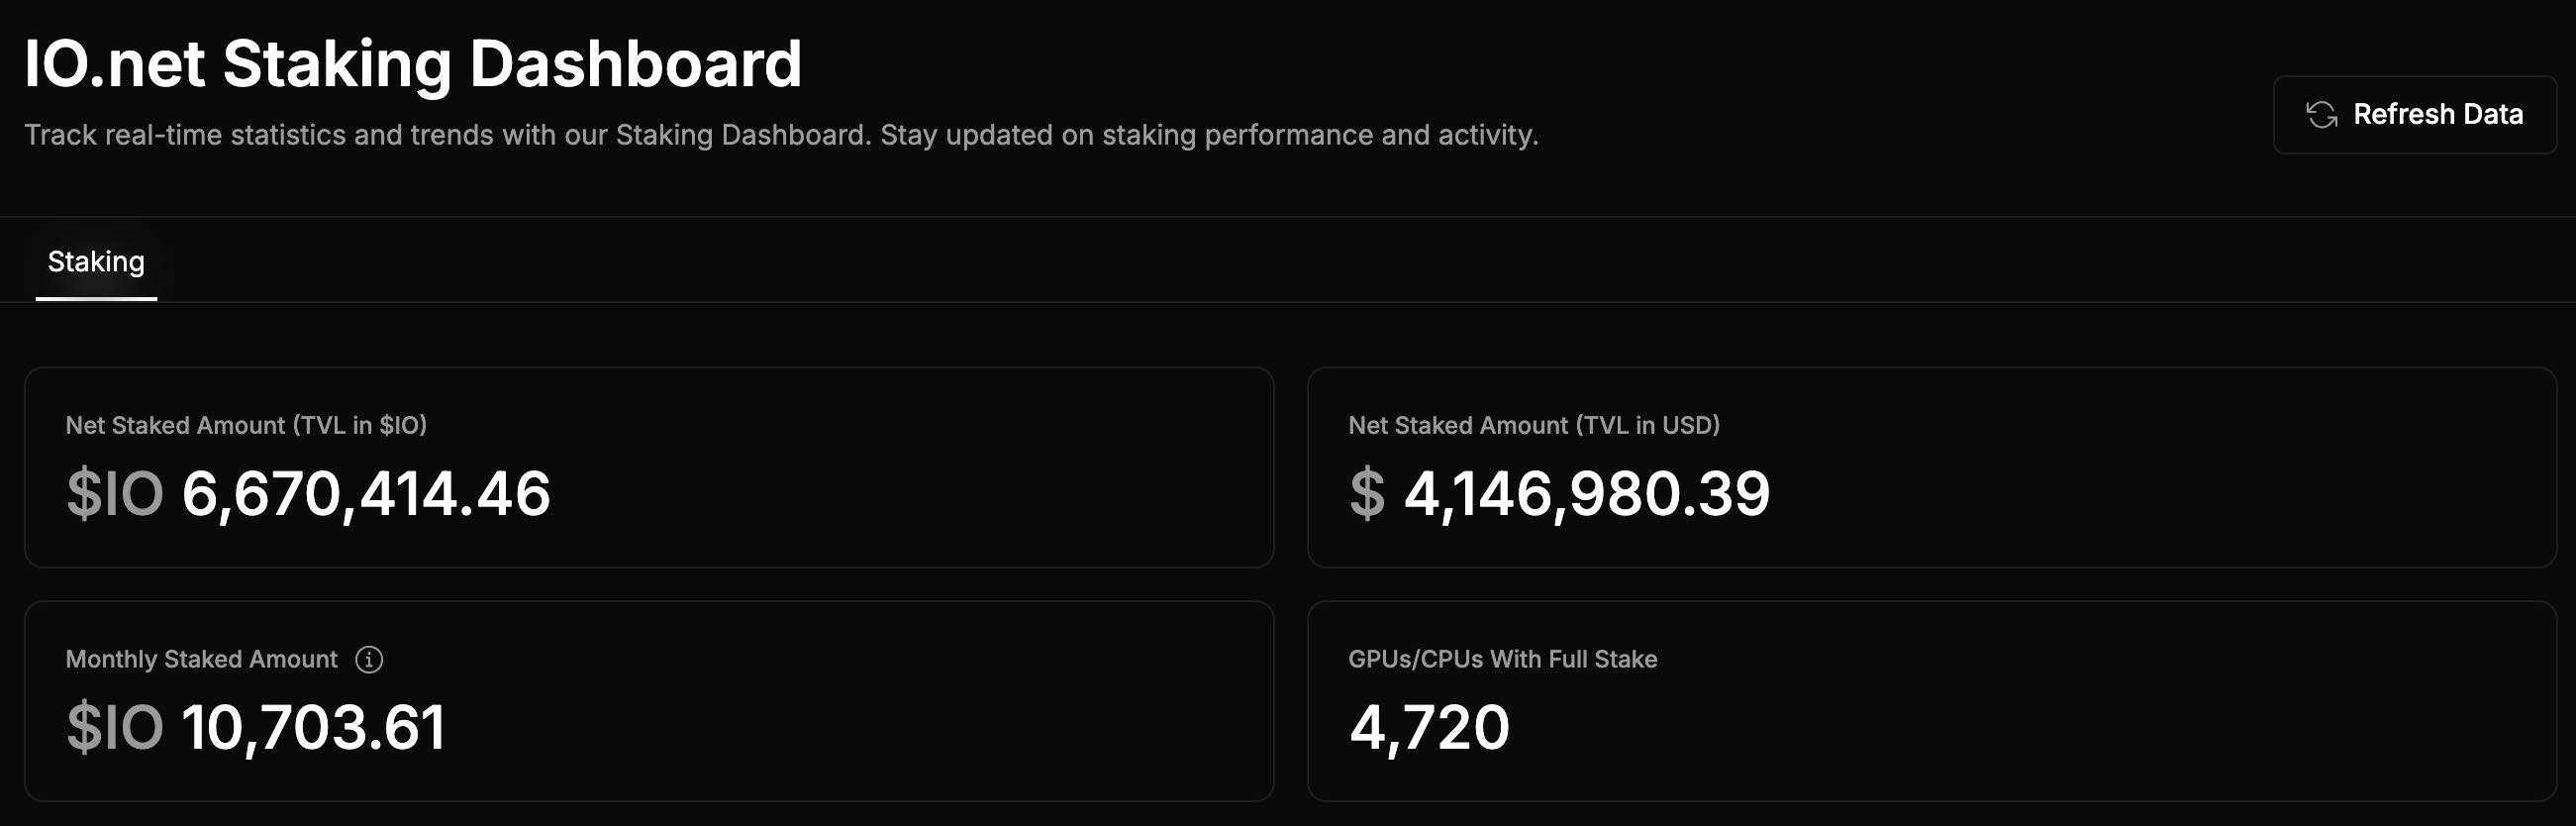
Auto-refresh: All data updates automatically every 10 minutes, but you can get the latest information instantly by clicking the Refresh Data button. You can also click the See it On Chain button to view it directly on Solscan for real-time data.
Staking Graphs and Visualizations
The Staking Dashboard includes several key metrics and graphs to help monitor staking performance over time:
- Net Staked Amount ($IO) – Represents active, currently staked funds (Total Value Locked in $IO).
- Monthly Staked Amount ($IO) – Reflects the total amount staked within the current month.
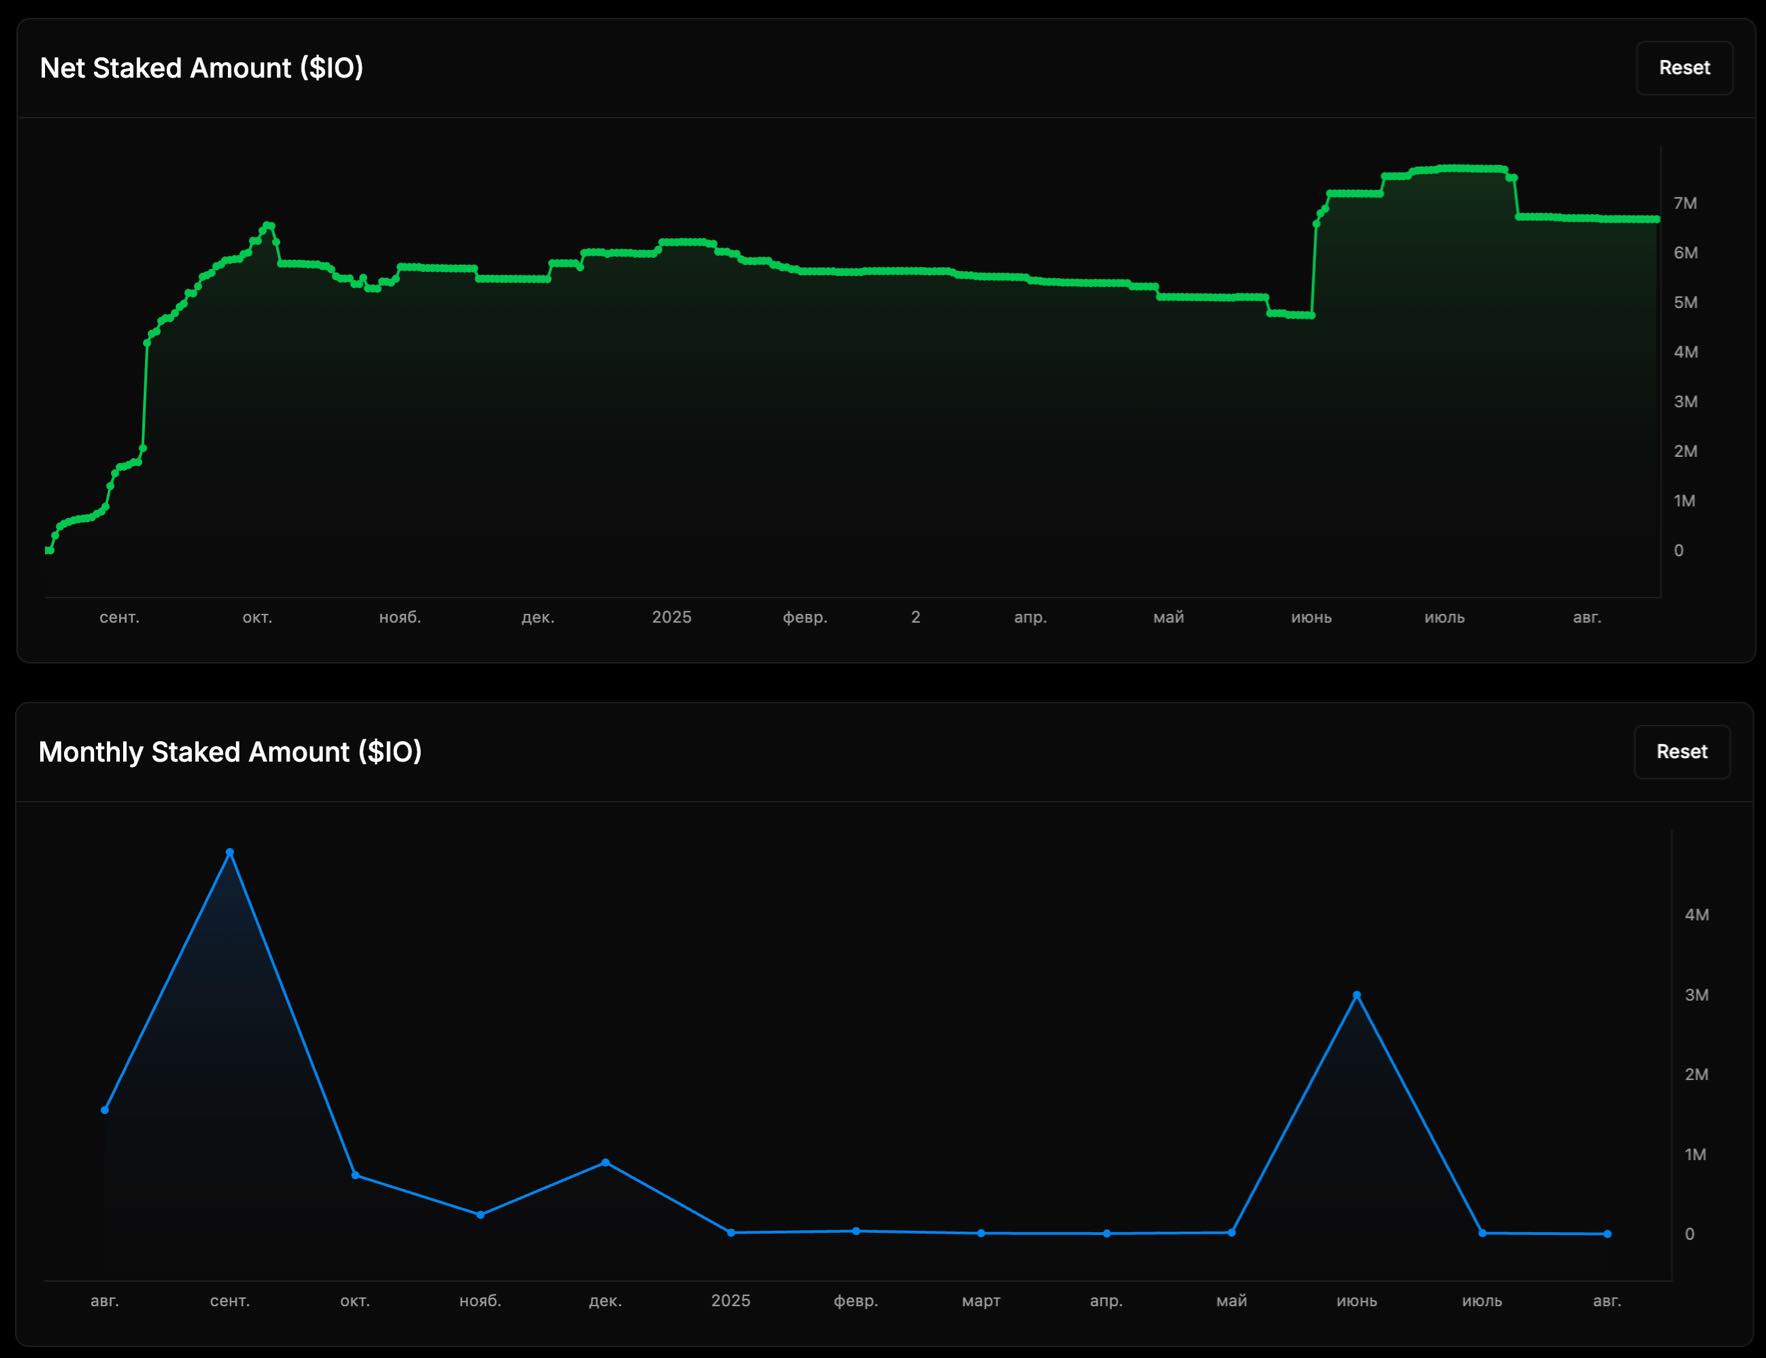
These visuals make it easy to monitor changes, spot trends, and gain actionable insights into staking performance.
Updated about 1 month ago