
Clusters Page
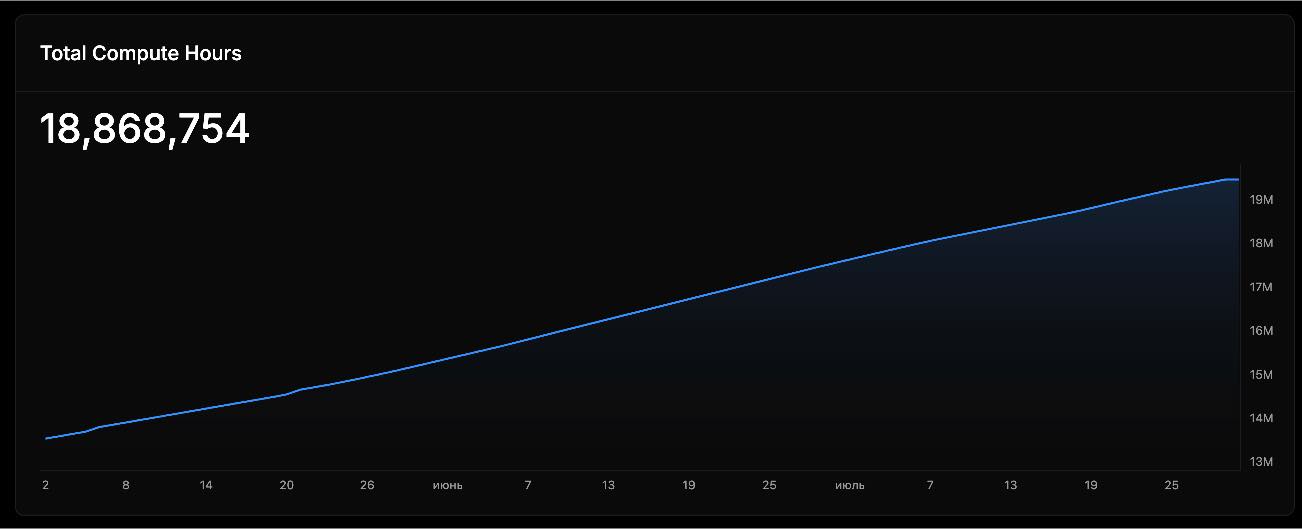
The Clusters Page provides a public overview of all deployed clusters within the network, along with real-time metrics on active bookings. This feature helps users assess the current status of computational resources and understand the demand for decentralized compute power.
Key Metrics Displayed:
- Total Compute Hours Served (cumulative processing time delivered by the network)
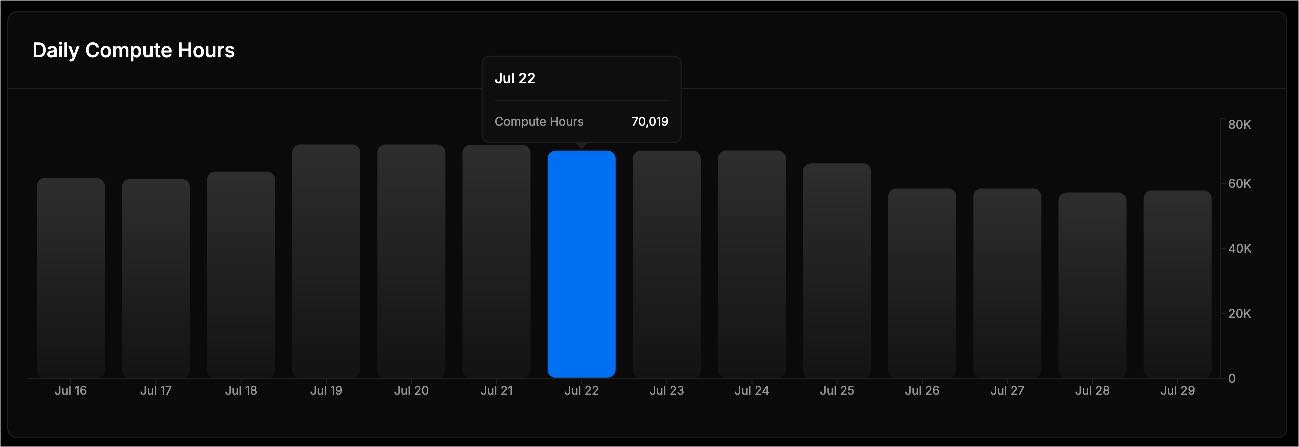
Daily Compute Hours
The Daily Compute Hours chart shows how many compute hours were contributed to the network each day.
- Hover on any bar to view the exact number of compute hours for that specific day.
- Monitor daily trends in supply and usage of GPU/CPU resources across the network.
- This visualization helps track fluctuations in compute availability and demand over time.
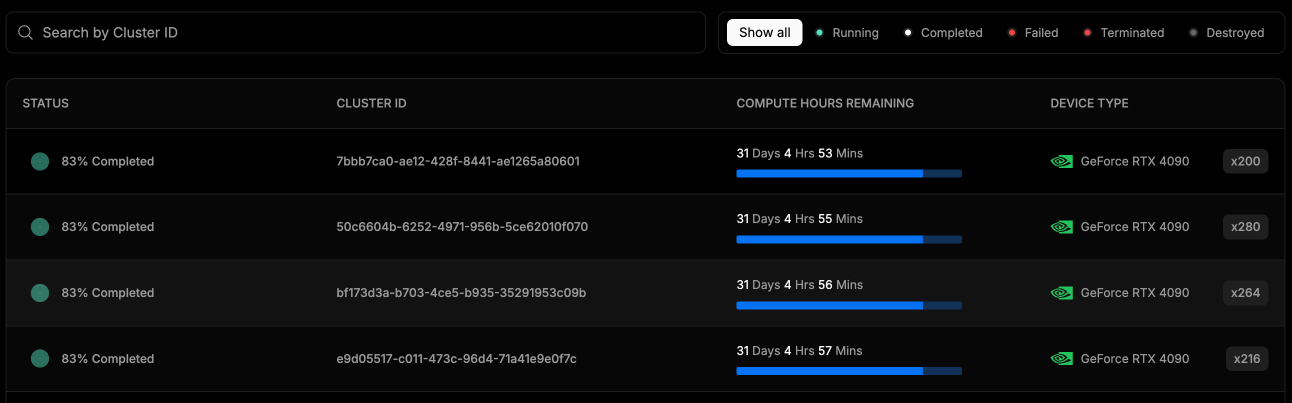
List of Clusters
The Clusters Table provides a transparent, real-time view of all deployed clusters and their associated compute bookings.
The table includes:
- Cluster Status (active, idle, or under maintenance)
- Cluster ID (unique identifier for each cluster)
- Remaining Compute Hours (available processing capacity)
- Device Types & Quantities (hardware resources within each cluster)
This page enables users to monitor compute resource availability, track network performance, and optimize cluster utilization in real time.
Updated 2 months ago